Sunday, December 27, 2015

Divergent Polls

Divergent Polls
Last week saw a rash of polls released. Here's a quick summary of those numbers:
This is a good crop of fairly consistent polls, all within the expected sampling error of each other. From these polls, we can conclude that Trump is on another major surge, reaching for that magic 40% range he needs to avoid a brokered convention. Meanwhile, Cruz is showing minor gains and Rubio appears to have stalled.

The most interesting thing, however, is not in these numbers. It's in these other numbers:
This is the same race, across the same nation, during roughly the same period of time. These polls tell a very different story, where Trump is struggling to expand his support beyond the 28% ceiling we've seen for months. Cruz has launched a major surge towards the front-runner slot, and Rubio's growth continues at a slow but steady pace.

Two Sets of Polls, Two Sets of Reality 
This is not a case of an outlier poll, like most political stories seem to be casting it. The odds of the generating the Quinnipiac poll as a statistical outlier from the first grouping is roughly 1 in a quadrillion less likely than the Fox News poll. That's 1 with 12 zeros behind it. If that isn't unlikely enough, think about the odds of that happening three times. 

This means that these are two very different modes, which are clustered within sampling error and are self consistent across multiple candidates. That's two different answers for what is happening, and they cannot be treated as polling the same reality.

What the *!@? is Happening Here?
The big question is what's so different about these two groups? For once, it's not cell phones. Both groups are using a similar mixture of landlines and cell phones with live interviews. Also, it's not registered voters vs likely voters, or live calls vs robocalls, or any of the other usual suspects. Looking at the other methodologies doesn't show any other tell-tale signs. The truth appears to be more subtle than that. 

Unfortunately, most of the pollsters don't like to reveal any of the deep internals of their models, or report any of the raw results. However, a deep dive into the cross tabs does show something interesting. I performed some statistical forensics to back out magnitudes of how many minorities were interviewed in the poll, inferred from the statistical variation between different categories of registered Republicans, such as "All Males" vs "White Males." Keep in mind that Gallup polls and exit polls from 2012 and 2014 put the number of minorities who are registered or self-identifying as Republicans somewhere around 11-13%. If these groups are interviewed at this proportion from the general populace, even on non-racial or non-political issues, we would expect to see a certain amount of differences solely from sampling variance. As the size of the group goes down, so does the variance. In short: if you think white people and minorities agree on everything down to 1%, you didn't bother to ask one of the groups.

For all of the first group of polls, the number of minority respondents appears to be very low, bordering on non-existent. Across all categories, the variation between these two groups is never more than one percent. That includes estimating Trump's support. If minorities seem to support a racist candidate like Trump as much as white people, there's something strange going on. 

In the second grouping, computing the crosstabs is a little different. Two of the pollsters (Suffolk & Quinnipiac) are university polls that flat out tell us how many minorities they reached. While they didn't break it down by ethnicity within the Republicans, both pollsters hit very close to the target number of Blacks without weighting, and did a good job of representing Hispanics and Asians with only a little undersampling.  Furthermore, they seem to give a good natural distribution from the very low income groups (<$30k/year) and younger age groups than the first grouping.

I dug a little deeper, and looked at results for the first group, going back three months. This is roughly the time period where we have seen the bifurcation of the polls that has so recently accelerated. It is also during this time that the undersampling of minorities seems to take place. The further back in time you go, the more "Whites" seem to differ from "All Republicans."

Conclusion A: Quality of Sample Matters
While excluding minorities isn't enough to explain the difference in polls by itself, it is a clear indication that the quality of the sample is bad for roughly half of the major pollsters. No amount of re-weighting will account for having only three Hispanics answer your poll. Also, this consistent degradation of the quality likely applies to other subgroups as well, since it is highly doubtful that these pollsters are just being racist somehow.

Conclusion B: Trump Might Be In For a Rude Awakening
As it stands, I could believe that many polls are not only suffering from higher than reported margins of error, they are also inadvertently introducing a consistant bias into the results. I caution readers to start treating the first group of pollsters with a certain amount of skepticism until February 9th (New Hampshire's primary) when we have a little more information to go on. The second group of polls, which show Trump stalled and Cruz rising fast, seem to be much more believable once you look under the hood. 

It is quite possible that Trump's 'lead' is still at -22%.

Thursday, December 10, 2015

Vaccines and Autism

Vaccines and Autism
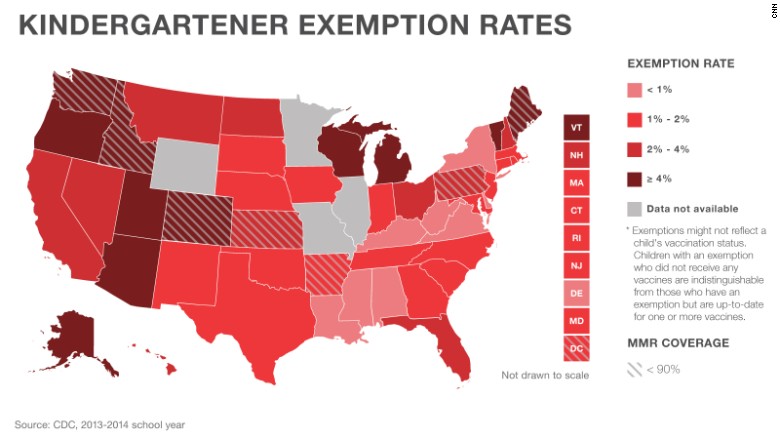
We're crossing over from politics into politically-charged science today, to talk about vaccines and autism. A small but growing number of parents are not vaccinating their children for fear of complications, most notably autism. Interestingly, this movement has a core following on both the far left and far right of the political spectrum.

According to the CDC, approximately 5% of the children in kindergarten had not had their Measles, Mumps and Rubella (MMR) vaccine. While this may seem like a relatively small portion of the population, it is important to remember that this threatens the "herd immunity" effect and even a small number of vulnerable children can pose a serious threat to infants who are not old enough to receive the vaccine. Furthermore, these densities are not evenly distributed across the nation, with groups of parents opting out of vaccines clustering together into regions of <80% adherence.


Greedy Big Pharma or One Greedy Individual?
The anti-vaccine movement appears to all stem from a 1998 study by a British gastroenterologist named Andrew Wakefield. He presented a paper where he claimed that he examined eight children who presented symptoms of autism shortly after receiving an MMR vaccine. According to the paper, these children all showed gastrointestinal distress, from which Wakefield postulated a complex theory of causes and effect. The method and approach of this study was a horrible example of bad science and bad statistics, where a small self-selected group of subjects were used without any objective measures like a control group or measures of coincidence, or even basic approval by a board of ethics. In fact, later studies have been unable to find any of the symptoms Wakefield describes. An excellent summary of the study can be found here.

Beyond the shoddy science behind the study is another shadier story. Apparently, Wakefield was not claiming that vaccines were bad in general. In fact, he had just patented his own MMR vaccine to compete with the one he claimed caused autism, expecting to make $43M a year. At the same time, he was also selling autism detection kits based on his "findings," an endeavor which the parents of several of his subjects were investors.

In the fallout from this flawed study and questioning of Wakefield's motives, the paper's publisher retracted the publication. Wakefield was found guilty of more than thirty charges and barred from practicing medicine in the UK. In 2011, Wakefield's own raw data was revealed, contradicting the results he presented in the paper.

Despite this overwhelming wave of evidence discrediting and contradicting every point in Wakefield's conclusions, he stands firm in his original position, claiming to be the victim of conspiracy and persecution from an establishment. While Wakefield himself is unable to realize the huge earnings he envisioned, plenty of others have been eager to pick up the banner (and the revenues) by positioning themselves as outsider medical experts.

537,303 Anecdotes 
To be fair, we will give Wakefield's theory a serious consideration and look at the statistics. His hypothesis is that the MMR vaccine is a direct cause of autism. It is clearly not a 100% causation (or else most of the children in the UK and US would have autism). Also, Wakefield does not claim that MMR vaccines are the sole cause of autism, so even unvaccinated children may still develop it. However, by this theory, we would expect a significant increase in the rate of diagnosis of autism for people who had the vaccine versus those whose parent's opted out.

There are a number of population studies that performed just that analysis. The largest, and possibly most relevant to Wakefield's theory, is a study of 537,303 Danish children who were born between 1991 and 1998 (matching the years in Wakefield's research). This study showed that the 82.0% that were given the MMR vaccine had the same risk of autism as the 18.0% who did not receive the vaccine.

Many[1] other[2] studies[3] also[4] show[5] no difference[6] in[7] autism[8] rates[9]. Regardless of how or why a vaccine could cause autism, simple observation shows that two populations, living side by side, have the same autism rate. You're not going to get a smaller margin of error than that.

Monday, December 7, 2015

Trump's Lead at -22%!

Trump's Lead at -22%!
Possibly the most misleading statistic being repeated in the Republican presidential nomination is that Trump is leading by double digits. I'm not talking about analysis of whether his supporters will vote, or whether the polls are biased towards his supporters. I'm referring to the fact that the eventual nominee will need 50% of the delegates. It doesn't matter if he has the most delegates. If he has anything less than 1237 out of the 2472 delegates, it will go to a brokered convention. This is a terribly convoluted process, where promises are made, arms are twisted, animals are sacrificed, and at least one deal with the devil will be made. However, the gist of it is that all of that mad scrambling is done by the "Establishment Republicans," and you can be sure that it would take a miracle for Trump to be the winner in that situation.

Only seven states use a winner-takes-all approach, for a total of 400 delegates. Another 28 states (1347 delegates) use a completely proportional system, or a system which is proportional if no candidate is above a threshold (usually 50%). The rest of the 725 delegates are allocated in some other hybrid approach. Let assume Trump continues to hold at about 28% support (a mildly generous reading of the polls), and is consistently the leader across all of the winner-takes-all states. Then he can expect around to get 400 + 1347*0.28 = 777 of these votes. That means he needs 460 of the 725 delegates (63%) that are awarded in hybrid schemes, a nearly impossible task if he is polling at 28%.

With this kind of allocation, maybe Trump doesn't need to reach a full 50% support to secure the nomination. With some good strategy or a bit of luck, he could make it happen with 40%, but anything less just isn't going to cut it.


Wednesday, December 2, 2015

Republican Primary Support Stagnates For Some, Surges for Others

Republican Primary Support Stagnates and Surges
A very interesting thing is happening in the Republican presidential primary. On one hand, Trump and Carson, the two front-runners have largely stalled in the polls. Carson saw a brief bump in the polls at the end of October, only to return to his late September/early October numbers in the most recent polls. An amalgamation of polls indicates that from Oct 1 to Oct 27, Carson rose approximately 7 points, before dropping that same 7 points from Oct 27 to Nov 15. Trump has held very steady since August 20. While trends are much easier to estimate than absolute percentages, all indications are that these two are sitting at 26.5% for Trump and 20% for Carson.

Further down the list, however, things are starting to change. Cruz and Rubio are both seeing significant steady momentum since October 1. Estimating using six pollsters, Cruz has gained 3.5% and Rubio has jumped 4.5%. While this may not seem like a lot, it is by far the largest momentum we have seen for anyone (other than Trump and Carson) since July. Also, this puts them both in the 12-14% range, which means that (a) 4% is a lot to their campaigns and (b) they are now posing credible challenges to Carson.


Sunday, November 29, 2015

Economic Recovery and Deepening Trends

Public Perception Pessimistic on Prosperity
If you were to ask a typical American about the state of the economy, you would get a fairly dire picture. A deep recession for the past seven years, soaring unemployment, a GDP falling behind China. How we yearn for the go-go 80s!

A recent poll from PRRI reports 72% of Americans believe the US is in a recession. This is hardly new, with regular polls going back seven years painting a similar picture. A whopping 80% believe that the size of China’s economy is comparable or better than the US. Unfortunately, I do not have a specific poll number regarding perception of unemployment, but it is a common cohort in discussions and articles that I have seen. Particularly common is the “informed” person who tells you that the ‘official’ unemployment doesn’t include people who have given up looking for work, and the real numbers are much, much worse.

Really??!?
These topics are not opinions, they are actually demonstrable facts with specific definitions. I am not claiming that everything is sunshine and rainbows in our economy, but let’s at least be correct in our statement of the facts. A quick look at some of these numbers. First, unemployment numbers going back to 1980:


Clearly unemployment has been on a steady road to improvement, with a rate of recovery steeper than any since 1983. As a nod to those who say that unemployment is a misleading number, let’s look at the employment numbers instead, also going back to 1980 for comparison. These are number of people who are actually employed or “seeking employment” divided by the US population at that time. While the total percentage of the US that wants to be employed is not as high as last decade, it is way above the 1980s and 1990s levels. What drop can be seen is immediately after the economic downturn, and has been slowly increasing since then. There is no sign of the “hidden unemployed” in these numbers.


The issue of China surpassing the US economy is fairly easy to debunk. USA 2014 GDP: $17.4T ($46.4k per capita). China 2014 GDP: $10.4T ($3.9k per capita) (source: TradingEconomics.com). Is the US GDP on the decline? The numbers below are the annual rate of growth. This shows numbers that are somewhat lower than average, but still represent consistent, meaningful growth. 


The Sad Truth: It’s Not the Economy, Stupid
There is a lot of talk about “under-employment” hiding the true employment numbers. What that term means is hard to quantify, and even harder to get direct numbers on. However, if “under-employment” is on the rise, we would expect to see more people earning less, and the wages of the bottom 50% to be dropping. Let’s look at the numbers.


This is where the real economic downturn can be seen. The bottom income levels and the poverty rates have been hit, and are not improving. However, even here, the common perception is missing the point. There is no increase in the number of “under-employed.” What we see here is the bottom of the economic spectrum was declining before the recession, and was further damaged by the recession like (nearly) everyone else. However, like the other economic groups, it has not improved. It has not participated in the recovery, but it has not gotten worse either. While the economy as a whole improves, the bottom 20% are stuck in place. This is not an economic issue, this is a wealth disparity issue, and improving the economy even more is not going to help these people.

While most Americans seem to think there is something rotten in the economy, it is highly unlikely that this issue is what they mean. There is a very real problem affecting a large portion of our citizens, and yet the focus is still on the perceived failings for the middle and upper segments. To provide any meaningful solution to give relief to the people who need it most, we need to know the facts and provide a focused plan to solve the real problem.